Calia Homes is pleased to share our monthly newsletter providing data and detailed insight into the Berkeley, Oakland, and Piedmont housing markets.
Feel free to reach out with any questions you may have about the data enclosed or the East Bay housing market.
Kind Regards,
Carrie and Jennifer and Calia Homes Team
510.980.9497 | caliahomes.com
How Do Small, Medium, and Large Homes Compare Across Three Cities?
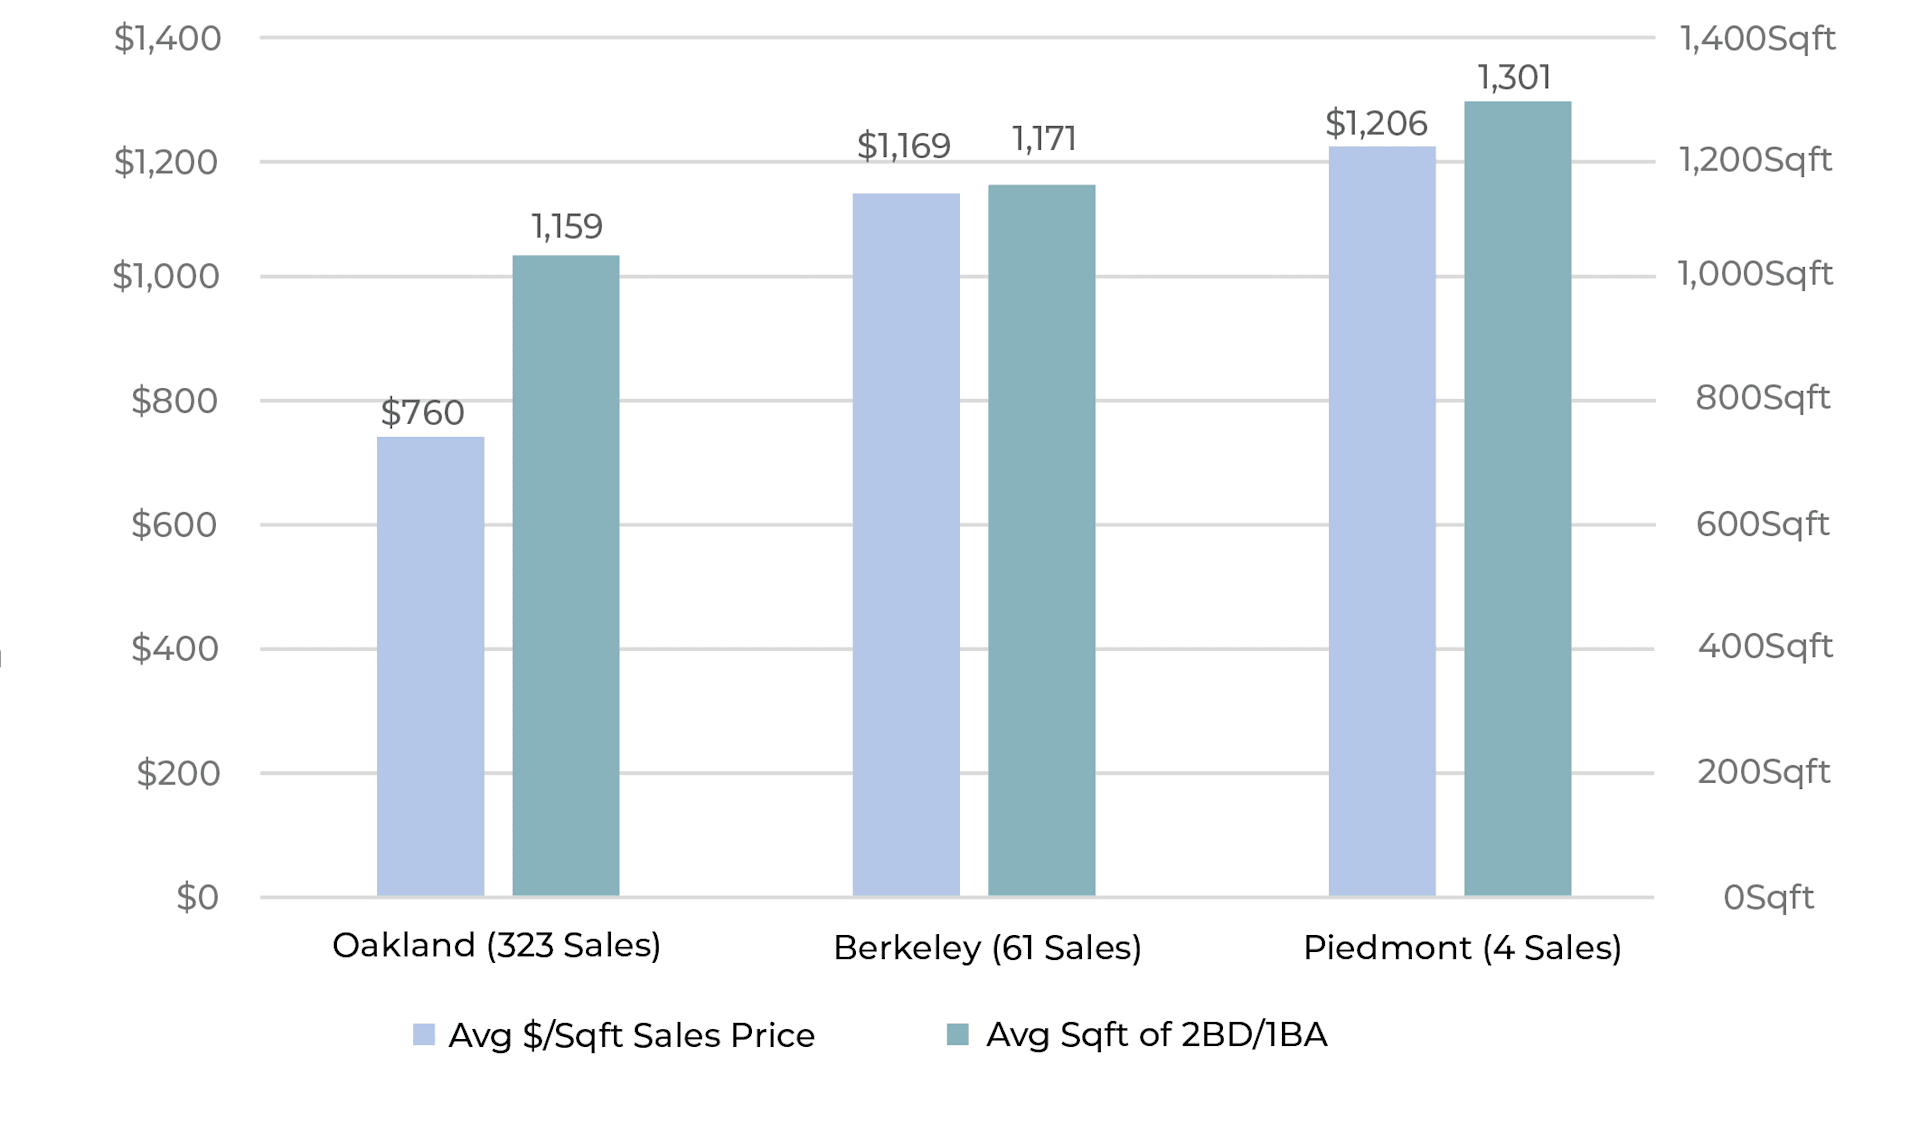
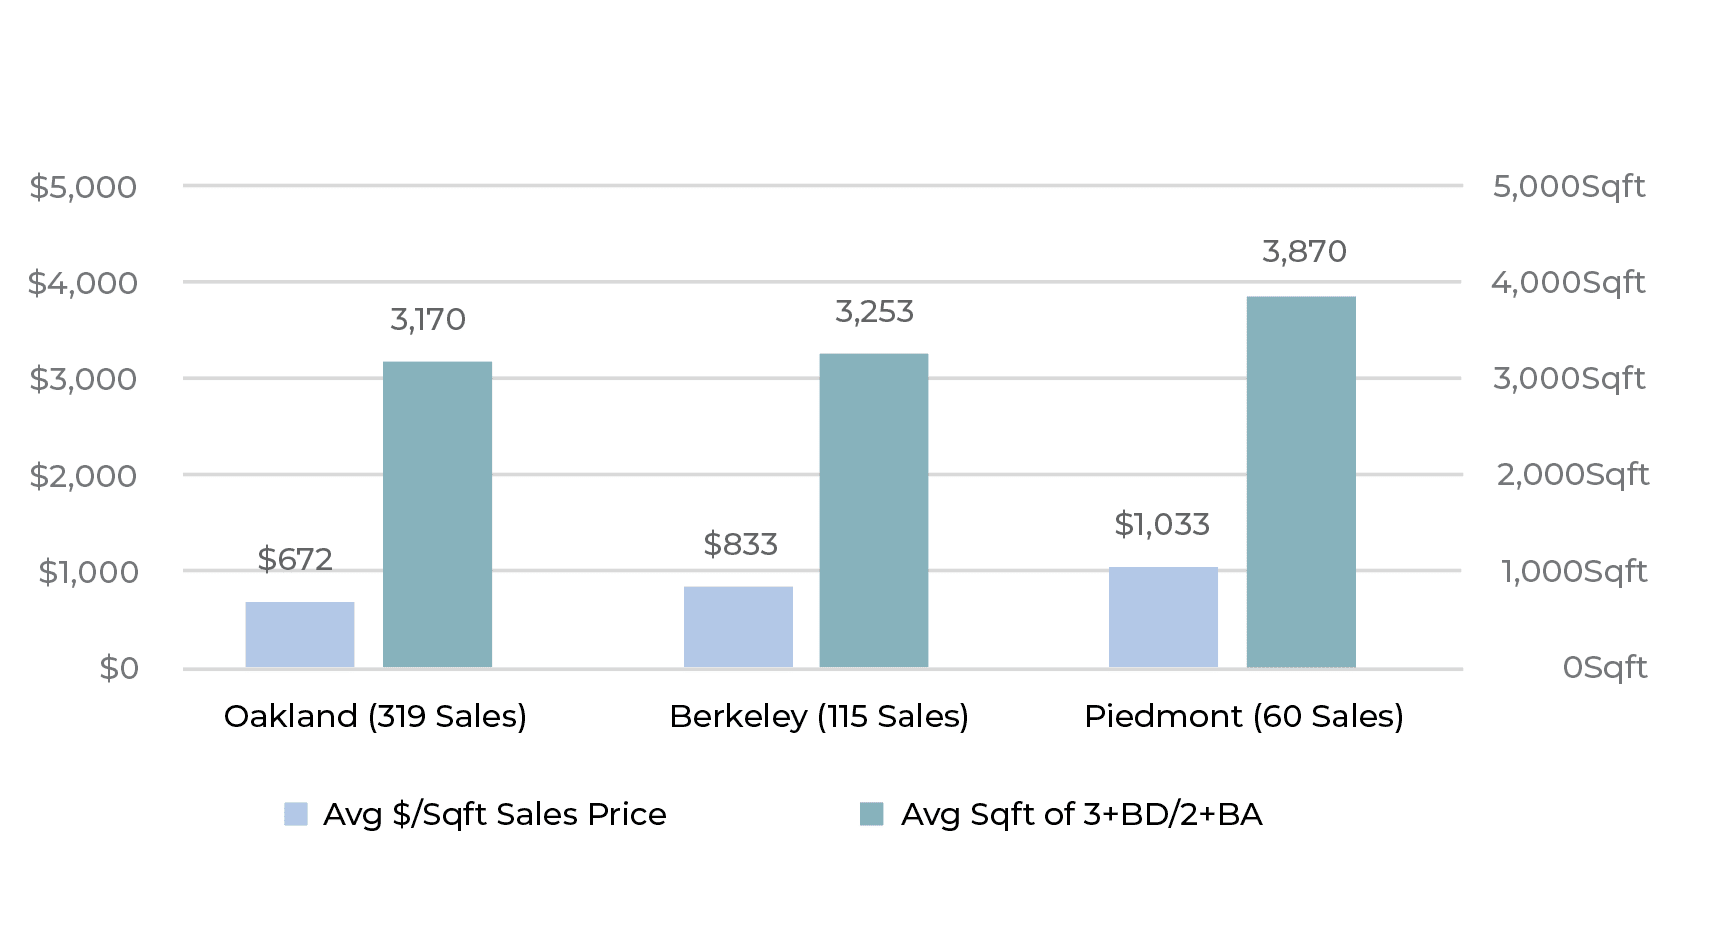
For this month’s Calia Homes newsletter, we compared dollar-per-square-foot ($/sqft) values across different-sized single-family homes in Berkeley, Oakland, and Piedmont.
Realtors® often talk about how $/sqft values decrease as homes get larger. Our research shows that this is the case.
In all three cities, smaller houses are sold on a higher $/sqft basis than larger homes. When comparing the data across cities, Piedmont has the highest $/sqft prices, on average, for all three size categories of homes
Housing Data Varies by City and by Neighborhood
(1,501-2,500 Sqft)
The highest city-wide $/sqft values appear to be in Piedmont, with a population of approximately 11,107. Oakland, by comparison, has a population of 433,823 - 39 times the size of Piedmont. (Berkeley falls in the middle with a population of 117,145.)
Because of the large variation in city sizes, we thought it would be interesting to compare Piedmont housing data to housing data for an adjacent Oakland zip code, 94618, with 17,324 people. (Population information from 2021 US Census Data.) The 94618 zip code includes Rockridge and Upper Rockridge.
Avg $/Sqft Sales Values of 3+BD/2+BA Homes in 2022(1,501-2,500 Sqft)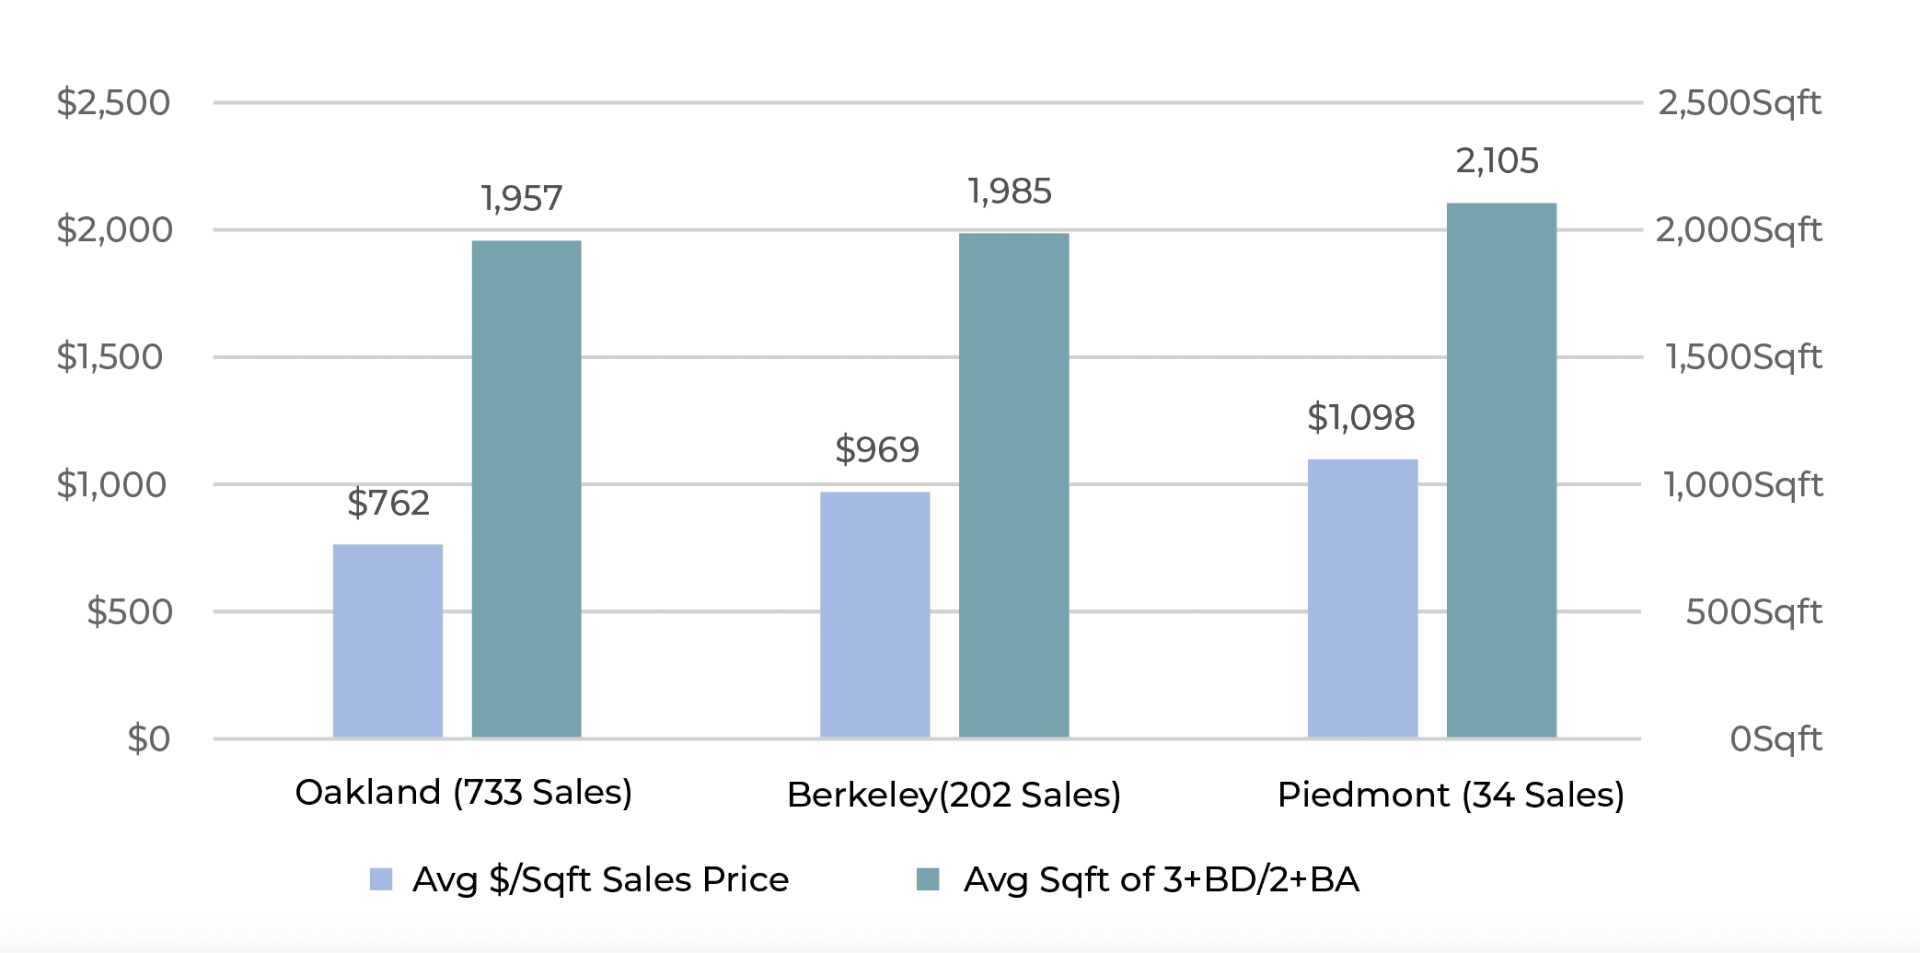
Avg $/Sqft Sales Values of 3+BD/2+BA Homes in 2022
A Closer Look At Rockridge
We found that 2-bedroom, 1-bath houses in Rockridge sold, on average, for 5% more than Piedmont homes of a similar size.
While the $/sqft prices for 3+ bedrooms, 2+bath homes (between 1,501-2,500 sqft) were similar across Rockridge and Piedmont, Rockridge homes in this mid-size group sold for nearly 1% more than in Piedmont. There were also more sales of homes in both size categories in Rockridge.
Looking at the data for larger-sized homes (2,501+ sqft), we found that there were more home sales in Piedmont and that, on an average $/sqft basis, they sold for nearly 18% more than in Rockridge.
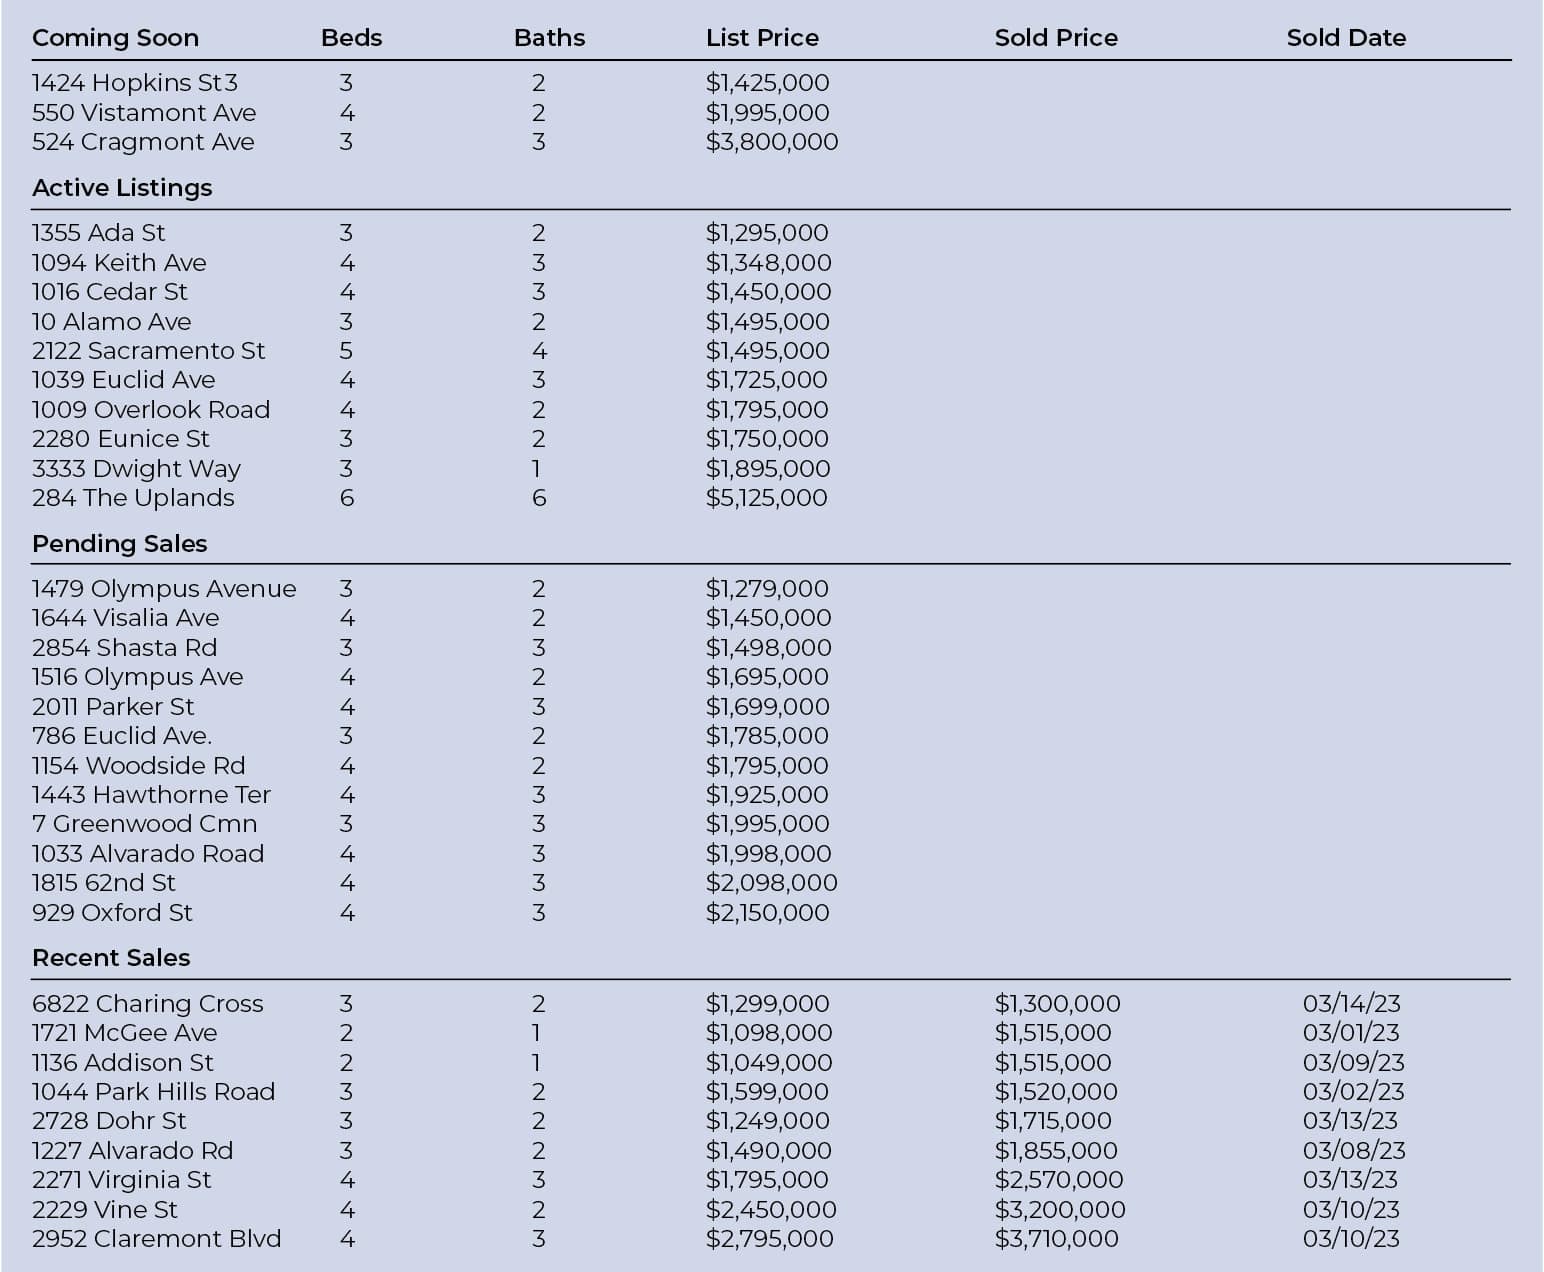
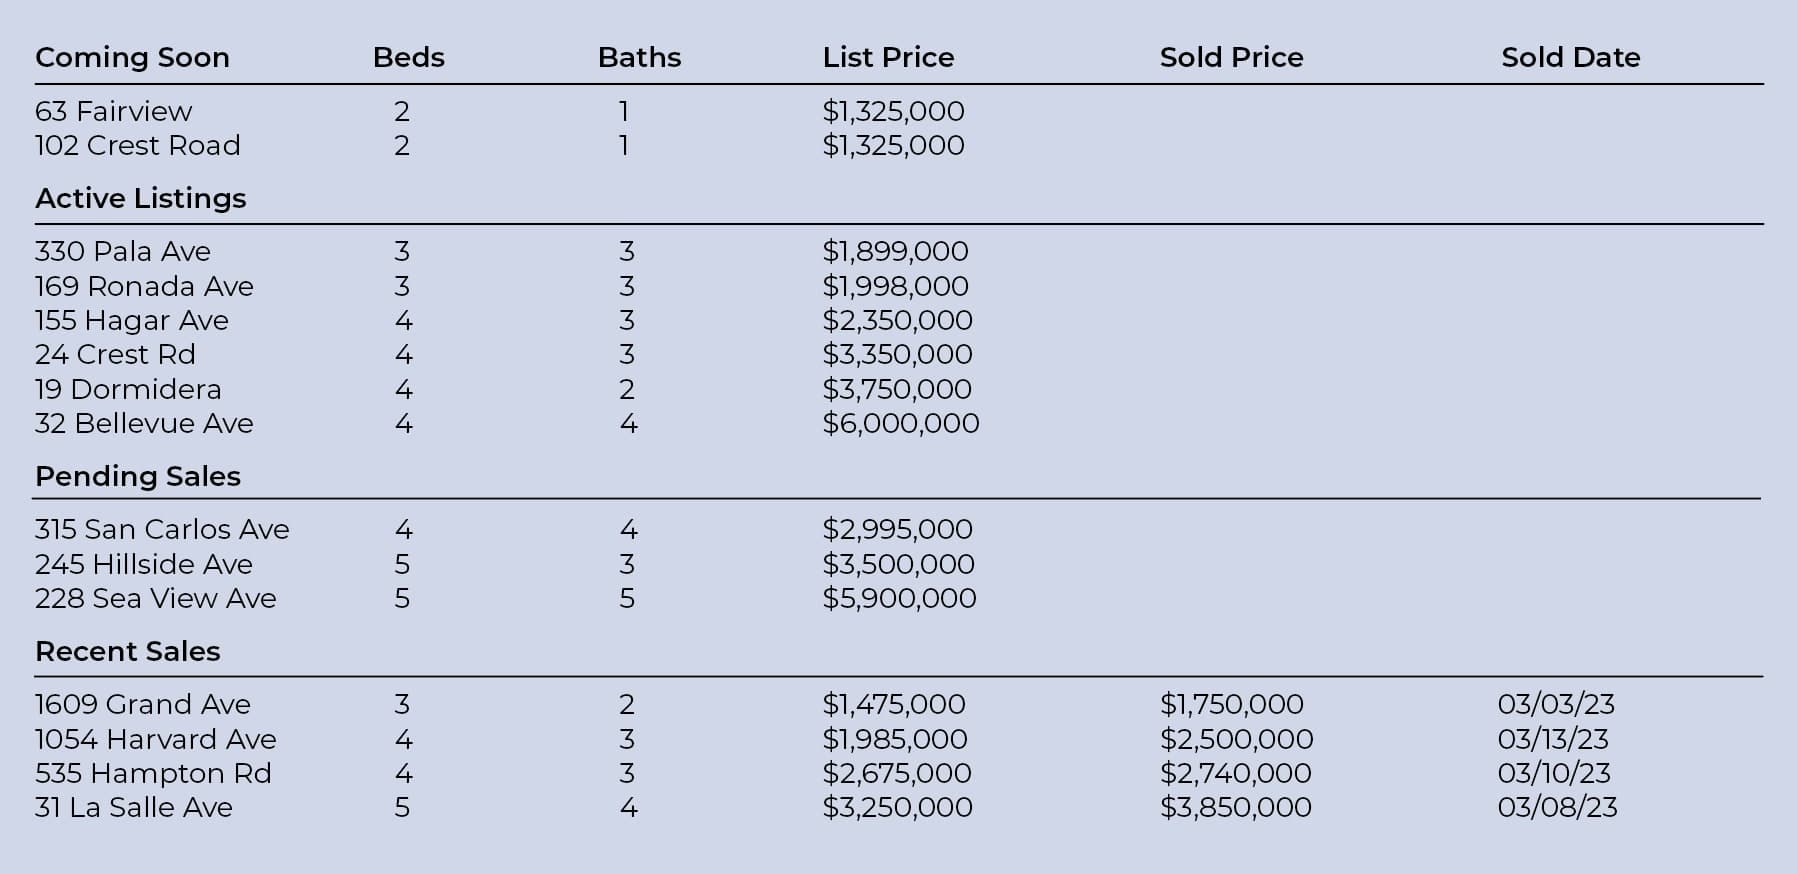
Recent Market Activity in Berkeley
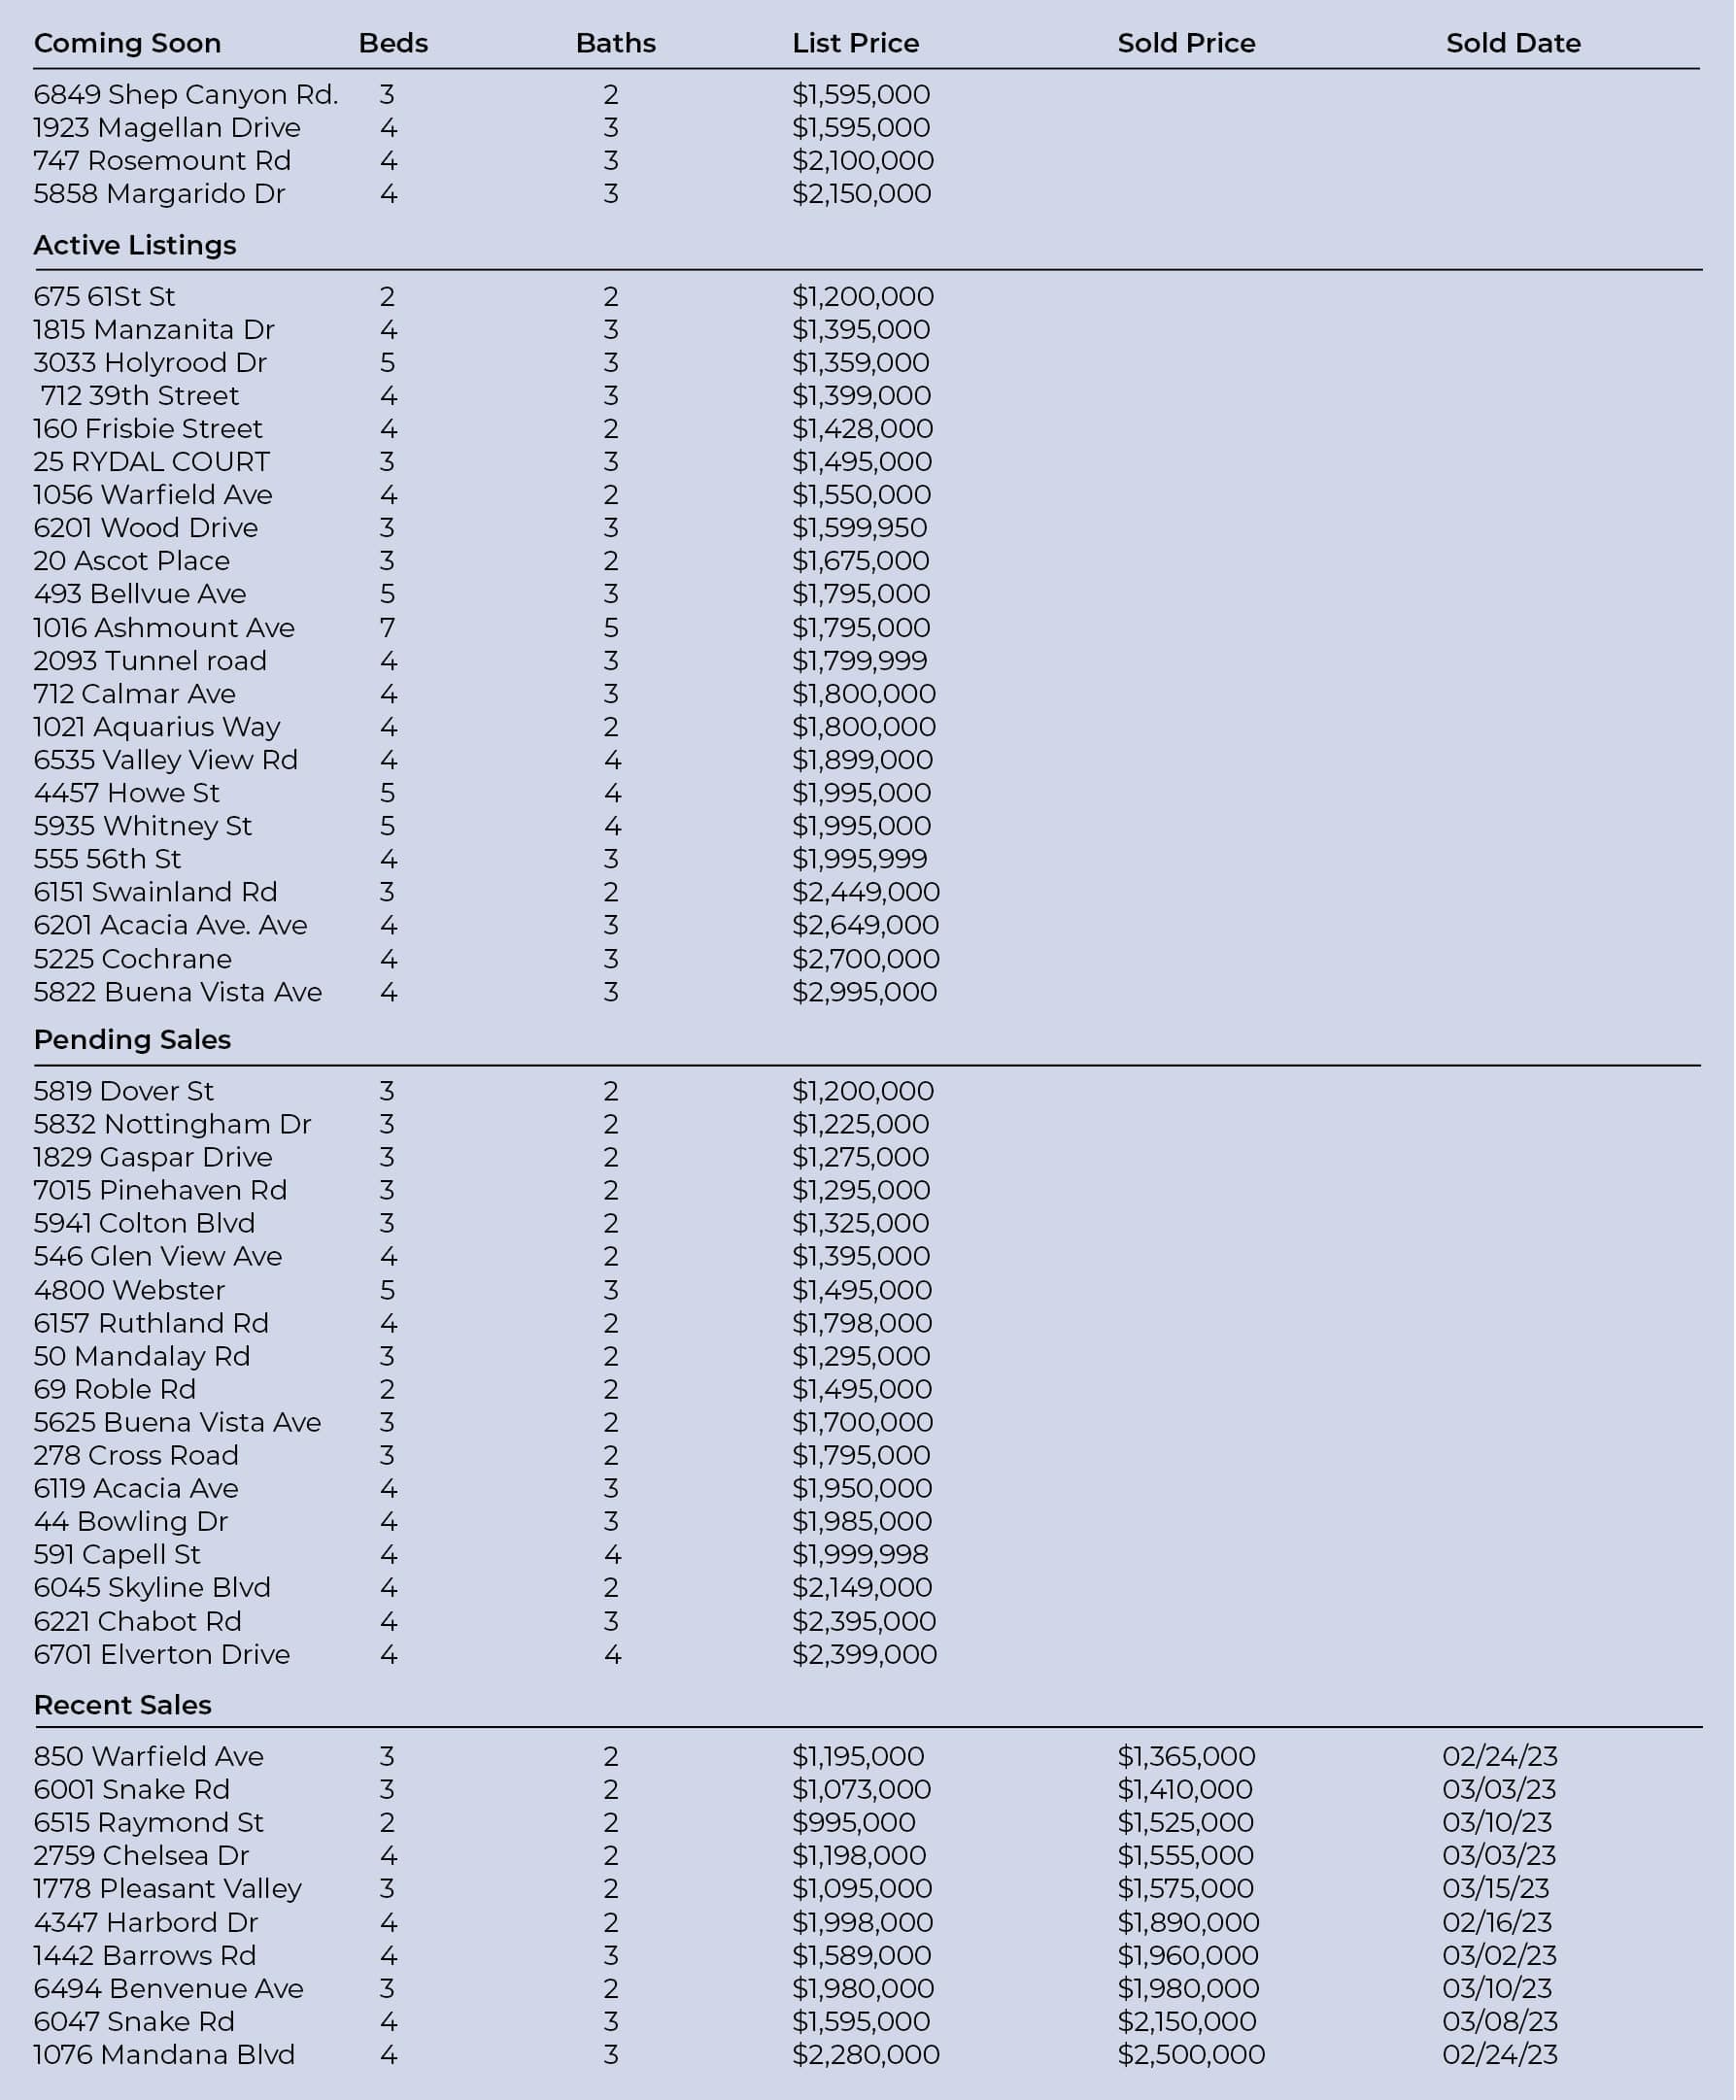
Recent Market Activity in Oakland
Recent Market Activity in Piedmont
Based on information from the MLS. All data, is obtained from various sources and has not been, and will not be, verified by the broker or MLS. All information should be independently reviewed and verified for accuracy. Properties may or may not be listed by the office/agent presenting the information.
Dedicated to clients, culture, and community, Calia Homes is a team of exceptional real estate professionals who work together with the common goal of providing unparalleled client services in a supportive and collaborative environment.
Our mission is to create smooth, successful – and even enjoyable – transactions in any market.